# The History Page
The History page is where you'll find all the historic results for your test runs. By default, you'll see results for the last two weeks on all your test suites and across the different Bespoken clients (API, CLI, Dashboard, Monitoring). Among the charts and data you can find are:
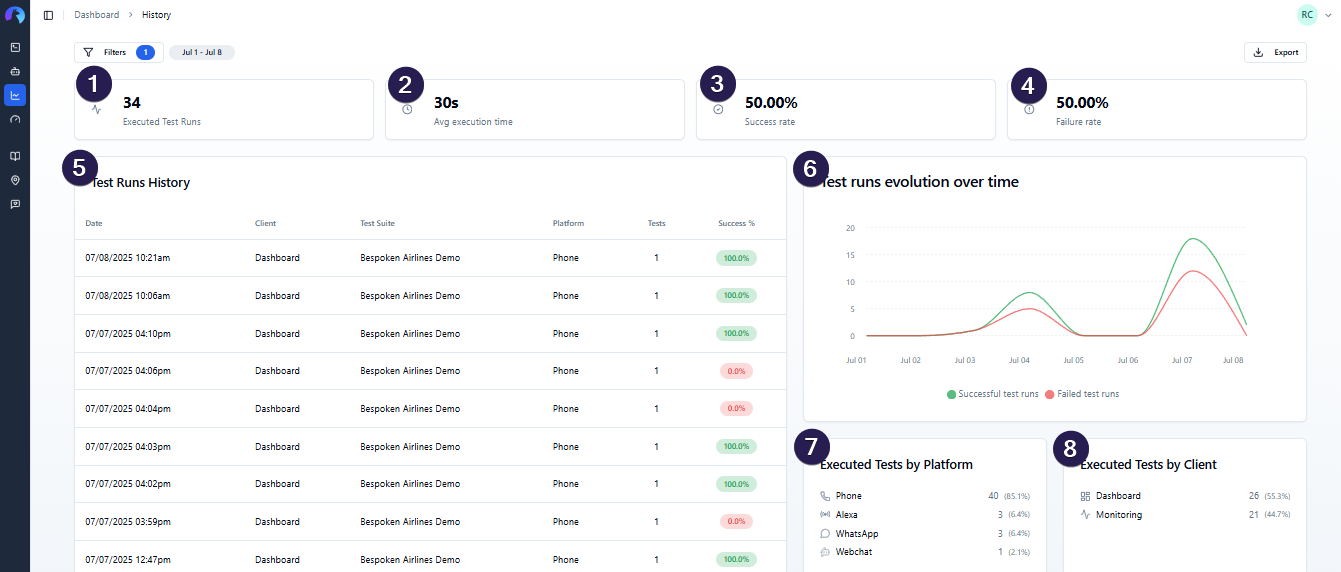
- Number of executed tests
- Average execution time per test
- Success rate for the selected dates
- Failure rate for the selected dates
- Test run results: Tabular data with information about the number of test suites and tests executed on a run.
- Test runs evolution over time: Line graphic that shows the number of executed tests, number of successful and failed tests per day.
- Test runs by platform: Chart that shows the percentage of tests executed across different platforms available.
- Test runs by client: Chart that shows the percentage of tests executed across different Bespoken clients.
All data can be filtered by Test Suite Name, Platform, Client, Result, and Dates by changing these values on the "Filters" button at the top of the page. Additionally, you can export your results by clicking on the "Export" button in the top right corner of the page.
# Test Run Results and Details
The test run results table at the bottom of the screen is where you'll find detailed information about each run with Bespoken. It comprises the following columns:
- Date and time of the test run
- Client used to run your tests (Dashboard, CLI, HTTP)
- Test Suite name
- Platform that was tested
- Number of tests executed
- Success percentage. This column is color-coded based on the results, where green represents a success level above 80%, yellow represents a success level above 50%, and red represents any value below that.
Clicking on any of the rows within the table will open a detailed view of said run with the following sections:
- Test suite execution data (date and time of execution, result, success rate)
- Test suite configuration data
- Detailed results for all test cases executed
The detailed results will show you all the steps executed per test including utterances, expected results, and actual results. Steps that were failed steps will be highlighted in red.
Finally, for each executed IVR and Webchat tests, recorded evidence is available to view, listen, and download.